SPL Graph
1.0Valutazione
Oct 19, 2024Ultimo aggiornamento
8.6Versione
Come installare il file .IPA
Condividi
Informazioni su SPL Graph
SPL Graph is an audio Sound Pressure Level (SPL) environmental noise analyzer, real-time frequency analyzer, chart recorder and data logger. It includes:
* Plot sound level over time
* Record audio while plot is running, playback to identify sounds that may have caused problems
* Capture video of events (optional in-app purchase)
* Do octave and 1/3 octave band analysis (optional in-app purchase)
* Show a 3D Plot of octave or 1/3 octave results
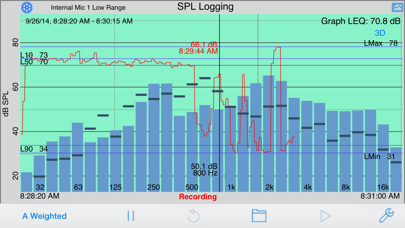
* Calculate Ln SPL values, L01, L10, L50, L90, L95, LMax and LMin
* Email notifications when sound exceeds pre-set limits
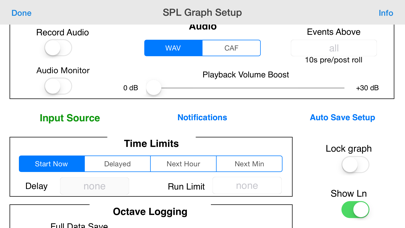
* Auto-save results after set intervals, and email the results to you
* Start another plot after auto-saving for continuous operation
SPL Graph works by averaging the SPL for a period of time that can vary from 0.1 second to 60 minutes, applying an optional weighting filter, and plotting the sound level, recording the raw audio signal, if recording is turned on.
For sound intervals of 1.0 second to 60 minutes, the optional octave and 1/3 octave logging modules allows storing the spectrum of the sound, for each interval.
The app works very well with the built-in iOS device microphone. To upgrade the app to true professional standards, add our iTestMic, iPrecisionMic, or iAudioInterface2 with an appropriate microphone, and get ANSI or ISO Type 1 or 2 results. With iPrecisionMic, you can send the system in to our calibration lab and get a calibration certificate for ISO 61672 and ANSI S1.4.
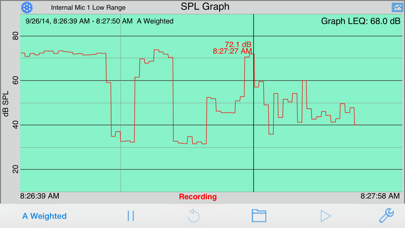
SPL Graph can record up to 24 hours of sound level data, with single second resolution. The graph starts with a one-minute plot window, and as a minute is recorded, the graph re-scales automatically and adds another minute to show the data collected so far. The overall SPL level, or LEQ, is displayed for whatever portion of the test is showing on the graph.
Tap the play button to play back the recorded audio, and you can use the cursor to scrub the audio location on the graph. Use this feature to listen to events that you can see on the graph.
With the optional octave logging module, you can also record the octave or 1/3 octave band levels. And, you can view the data on the 3D plot for a graphical view of frequency over time.
You can scroll and scale the graph vertically, in dB, by using standard swipe and pinch gestures. You can also scroll and expand and contract the time axis using gestures. Zoom out to a full 24 hours, or zoom in to a single minute, showing second resolution. Double-tap the screen to zoom out to show the entire graph on the screen.
The time scale grid changes dynamically, highlighting minutes, ten-minute, and hour lines as as it runs.
As the graph runs, the overall LEQ (average SPL) for the entire time period is computed and displayed on the screen. Swiping across the graph brings up a cursor that displays the exact dB level and time for any point on the graph.
You can turn on audio recording, so that you have a record of the sounds that were happening while the graph was being stored. You can use this to figure out exactly what the sound was that caused a peak on the graph, for example. Recordings can be compressed or uncompressed.
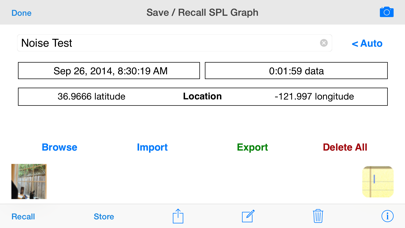
If you exit the app, or are interrupted with a phone call, the graph data will not be lost. SPL Graph will automatically save the graph, and reload it when you next open the program. You can also save a graph in one of ten files on the iPhone, so that you can recall the graph later.
SPL Graph supports saving graphs directly on your iOS device. You can recall these graphs and bring them up on the screen, and listen to the sounds that were made while the graph was recorded. You can also store an image of the screen to your photo roll. Use Dropbox or iTunes Files Sharing to export the results to your computer.
You can also export data in tab-delimited files for XLS import using iCloud.
The filters are all ANSI type 1 or better, and include A-weighting, C-weighting, and all octaves band filters from 32 to 16kHz.
* Plot sound level over time
* Record audio while plot is running, playback to identify sounds that may have caused problems
* Capture video of events (optional in-app purchase)
* Do octave and 1/3 octave band analysis (optional in-app purchase)
* Show a 3D Plot of octave or 1/3 octave results
* Calculate Ln SPL values, L01, L10, L50, L90, L95, LMax and LMin
* Email notifications when sound exceeds pre-set limits
* Auto-save results after set intervals, and email the results to you
* Start another plot after auto-saving for continuous operation
SPL Graph works by averaging the SPL for a period of time that can vary from 0.1 second to 60 minutes, applying an optional weighting filter, and plotting the sound level, recording the raw audio signal, if recording is turned on.
For sound intervals of 1.0 second to 60 minutes, the optional octave and 1/3 octave logging modules allows storing the spectrum of the sound, for each interval.
The app works very well with the built-in iOS device microphone. To upgrade the app to true professional standards, add our iTestMic, iPrecisionMic, or iAudioInterface2 with an appropriate microphone, and get ANSI or ISO Type 1 or 2 results. With iPrecisionMic, you can send the system in to our calibration lab and get a calibration certificate for ISO 61672 and ANSI S1.4.
SPL Graph can record up to 24 hours of sound level data, with single second resolution. The graph starts with a one-minute plot window, and as a minute is recorded, the graph re-scales automatically and adds another minute to show the data collected so far. The overall SPL level, or LEQ, is displayed for whatever portion of the test is showing on the graph.
Tap the play button to play back the recorded audio, and you can use the cursor to scrub the audio location on the graph. Use this feature to listen to events that you can see on the graph.
With the optional octave logging module, you can also record the octave or 1/3 octave band levels. And, you can view the data on the 3D plot for a graphical view of frequency over time.
You can scroll and scale the graph vertically, in dB, by using standard swipe and pinch gestures. You can also scroll and expand and contract the time axis using gestures. Zoom out to a full 24 hours, or zoom in to a single minute, showing second resolution. Double-tap the screen to zoom out to show the entire graph on the screen.
The time scale grid changes dynamically, highlighting minutes, ten-minute, and hour lines as as it runs.
As the graph runs, the overall LEQ (average SPL) for the entire time period is computed and displayed on the screen. Swiping across the graph brings up a cursor that displays the exact dB level and time for any point on the graph.
You can turn on audio recording, so that you have a record of the sounds that were happening while the graph was being stored. You can use this to figure out exactly what the sound was that caused a peak on the graph, for example. Recordings can be compressed or uncompressed.
If you exit the app, or are interrupted with a phone call, the graph data will not be lost. SPL Graph will automatically save the graph, and reload it when you next open the program. You can also save a graph in one of ten files on the iPhone, so that you can recall the graph later.
SPL Graph supports saving graphs directly on your iOS device. You can recall these graphs and bring them up on the screen, and listen to the sounds that were made while the graph was recorded. You can also store an image of the screen to your photo roll. Use Dropbox or iTunes Files Sharing to export the results to your computer.
You can also export data in tab-delimited files for XLS import using iCloud.
The filters are all ANSI type 1 or better, and include A-weighting, C-weighting, and all octaves band filters from 32 to 16kHz.
Screenshot di SPL Graph


Più popolare
Sing It - Ear TrainerA must app for every musician, singer, or just for fun.
Test,train, and improve your musical ear an
Tube PiP - PiP for YouTubeTube PiP - the ultimate YouTube companion for iOS:
1. Picture in Picture (PiP) Playback: Watch YouT
Papaya Ouch!In the game Papaya Ouch!, you can experience backpack management, tower defense, TD, merge, match 2,
Lets Go VPNLets Go VPN, the most advanced VPN, is designed by a team of top developers who strive to ensure all
Paprika Recipe Manager 3Organize your recipes. Create grocery lists. Plan your meals. Download recipes from your favorite we
War Pigeons UnboundedWar is coming. Deep down in top secret military labs they have evolved, mutated - and escaped. The f
Procreate PocketApp of the Year winner Procreate Pocket is the most feature-packed and versatile art app ever design
Cowboy Westland survival runAre you ready to take part in the #1 exciting 3D western adventure? Cowboy Westland survival run mak
Max: Stream HBO, TV, & MoviesIt’s all here. Iconic series, award-winning movies, fresh originals, and family favorites, featuring
TonalEnergy Tuner & MetronomeFor musicians from pros to beginners, whether you sing, play a brass, woodwind or stringed instrumen
SkyView®SkyView® brings stargazing to everyone. Simply point your iPhone, iPad, or iPod at the sky to identi
Ninja Dash 2015Ninja Dash 2015 is the fast paced running game!<br>On these maze fields, rush to the end of this nin
Tami-Live Chat&VideoTami is an app that records daily life and ideas.<br><br>You can use it to record your every day, wh
SALE Camera - marketing camera effects plus photo editorSALE Camera Help you create the best Business to consumer Stock Photos and Images. provides 300 filt
DevTutor for SwiftUI"DevTutor" is an application designed to assist developers in creating exceptional apps using SwiftU
Mokens League SoccerDive into Mokens League Soccer and experience the new era of soccer gaming!
Esports for Everyone: W
Zombie ZZOMBIE ENDLESS RUNNER LIKES NO OTHER!<br><br>WHY?<br><br>* Awesome graphic quality!<br><br>* Simplif
Dead Z - Zombie SurvivalCatastrophic explosion at the Omega Labs started the apocalypse, now spreading across the Earth.
Ta
HotSchedulesHotSchedules is the industry's leading employee scheduling app because it’s the fastest and easiest
ChatGPTIntroducing ChatGPT for iOS: OpenAI’s latest advancements at your fingertips.
This official app is
Disney StoreDisney Store is your official home for exclusive collections, designer collaborations, and one-of-a-
fight back tennisa Pong game with Tennis style, the gameplay itself is very simple, you can using Touch. Ball speed w
Dr. Mina AdlyMina Adly mobile app provides students with portable instant access to a selection of services.
Usi
iVerify BasiciVerify Basic is your gateway to enhanced device security and threat awareness, offering a glimpse i